


From Wizz Air to IndiGo: Cirium Emissions Review 2025 Reveals Who’s Leading and Who’s Missing

- Cirium’s 2025 report ranks airlines by real emissions data, highlighting that smaller, younger fleets are often the most efficient.
- Indian airlines IndiGo, Air India Express score well on short-haul efficiency but lack visibility in long-haul and improvement metrics.
- EmeraldSky enables accurate, route-level emissions tracking, pushing the aviation industry toward greater transparency.

As global aviation stretches toward a net-zero horizon, clarity has often been lost in a haze of half-measured promises and inconsistent reporting. This year, however, the Cirium Flight Emissions Review offers something more grounded: a standardised, data-rich account of who’s truly making progress, and where the industry still falls short.

Based on the EmeraldSky emissions intelligence engine, Cirium’s Flight Emissions Review 2025 goes further than its predecessors, analysing over 34,000 global airline routes, applying consistent CO₂ per Available Seat Kilometre (CO₂/ASK) methodology, and exposing the operational DNA behind carbon efficiency.
The result is both technical and revealing: a diagnostic tool for airlines, financiers, and regulators, and a reality check for nations like India, which stand at the crossroads of growth and sustainability.
Behind the Rankings: Efficiency, Not Size, Tells the Story
In a world where scale often steals the spotlight, Cirium’s data offers a different kind of leaderboard, one where small and mid-sized carriers frequently outperform their larger, legacy counterparts. Hungary’s Wizz Air took the global lead in 2024 with an emissions intensity of just 53.9 g CO₂/ASK, unchanged from the previous year. It was followed closely by USA’s Frontier Airlines (54.4 g), Turkey’s Pegasus (57.1 g), and Mexico’s Volaris (57.9 g). These airlines didn’t make the cut because they were big, but because they were efficient.

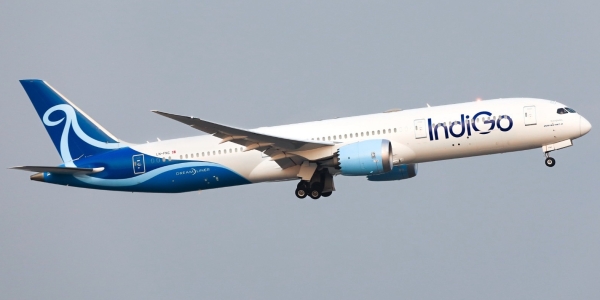
India’s IndiGo, flying an expansive domestic network on a modern A320neo fleet, was placed fifth globally at 58.2 g CO₂/ASK, with a modest year-on-year increase of 1.6 per cent. Its peer, Air India Express, landed at No. 10, posting 60.5 g CO₂/ASK. While these numbers are commendable, especially for a fast-growing aviation market like India’s, they highlight an interesting asymmetry: Indian airlines perform well on efficiency, but are largely absent from the broader transformation narratives that dominate Europe and North America.

“As the industry faces continued pressure to decarbonize, accurate and independent emissions data is no longer a nice-to-have—it’s essential.”
— Jeremy Bowen, CEO, Cirium
The efficiency story across the top 20 airlines in 2024 reveals clear trends. The top-ranked carriers operated fleets with an average age of just 4–7 years, significantly younger than the global fleet average of 11.1 years. Aircraft types matter too; winners increasingly fly A320neo, 737 MAX, or A220 variants with denser cabin configurations, maximising ASK while minimising per-seat emissions.
Region to Region: Where You Fly Shapes How You Emit
Cirium’s decision to break down emissions into intra- and inter-regional segments offers some of the most meaningful insights in the report. These aren’t just technical categories; they reflect how regulatory frameworks, fleet policies, and geography combine to shape real-world outcomes.
In North America, the regional average in 2024 stood at 74.1 g CO₂/ASK, with Frontier (55.3 g) and Spirit (59.0 g) continuing to dominate through youthful fleets and narrowbody operations. Southwest Airlines, a legacy low-cost carrier, posted a much higher figure of 68.9 g, suggesting that scale alone cannot carry a sustainability narrative.

Western Europe offered a similar profile. Wizz Air’s intra-European network returned 54.0 g CO₂/ASK, again topping the chart. Meanwhile, Ireland’s Ryanair (63.2 g) and Netherlands’ Transavia (62.1 g) followed close behind. The regional average—67.3 g CO₂/ASK—remains lower than North America’s, likely influenced by the EU’s more aggressive carbon pricing mechanisms under the European Union Emissions Trading System (EU ETS).
In Southeast Asia, emissions intensities edged higher. The regional average of 75.5 g CO₂/ASK reflects a more fragmented regulatory environment and mixed fleet maturity. While Scoot (64.4 g) and VietJet Air (67.2 g) posted solid figures, other carriers in the region, such as Cebu Pacific (70.8 g) and Thai Lion Air (71.7 g), pointed to the variability in efficiency even within short-haul markets.

“The carriers dominating the lowest Emissions Intensity rankings operate some of the youngest fleets in the industry and use high-density cabin configurations to spread their emissions across more seats.”
— Mike Malik, CMO, Cirium
Interestingly, Latin America recorded a regional average of 67.5 g, better than both Southeast Asia and North America. Arajet (51.9 g) and JetSmart (56.6 g) led the way, largely on the back of ultra-efficient narrowbody usage and simple point-to-point networks. It’s a quiet success story that deserves more attention.
Inter-Regional Patterns: Widebodies, Long Routes, and Subtle Gains
Flying across continents presents a different challenge altogether. Long-haul operations, particularly across the Atlantic and Pacific, feature higher baseline emissions, but they also offer the clearest test of operational efficiency at scale.
In the North Atlantic, the average emissions intensity was 78.8 g CO₂/ASK in 2024. Here, lesser-known carriers punched above their weight: French Bee led with 55.0 g, followed by Azores Airlines (56.3 g) and Norse Atlantic (60.1 g). These results weren’t incidental. French Bee, for instance, deployed A350-900s with over 400 seats and operated an average sector distance of 7,384 km, a sweet spot for aircraft like the A350 to outperform older widebodies.
Across the Transpacific, Zipair Tokyo emerged at the top with 63.9 g CO₂/ASK, beating legacy heavyweights like Delta (76.2 g) and United (74.4 g). The longer sector lengths, averaging over 10,000 km, amplify aircraft differences. Carriers operating 787s, A350s, and newer widebodies consistently outperformed those still flying older 777-200s and A330-300s.
Yet, perhaps more important than who’s on top is how steep the gap remains between best and worst performers on the same routes. This difference, often 20 g CO₂/ASK or more, can translate into thousands of tons of extra emissions annually, per airline, on just a handful of routes.
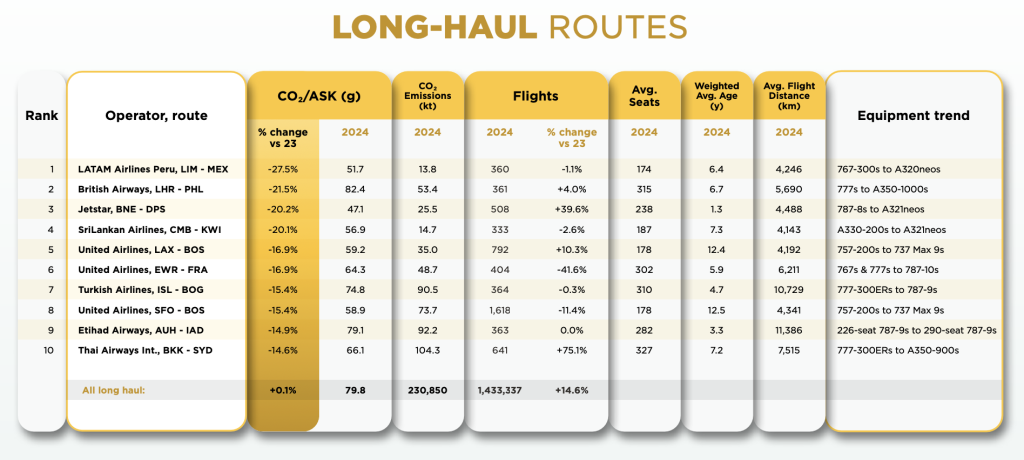
Routes That Moved the Needle
If the big picture is compelling, the route-level data is where the action is. Cirium’s granular tracking of year-over-year improvement exposes where airlines are taking meaningful steps.
In the long-haul category, LATAM’s Lima-Mexico City route saw a staggering 27.5 per cent reduction in emissions intensity after a fleet switch from older 767s to narrowbody A320neos. SriLankan Airlines’ Colombo-Kuwait route improved by 20.1 per cent, thanks to replacing A330s with denser A321neos.

Even on short-haul sectors, the changes were visible. JetBlue’s JFK–Nashville and JFK–Rochester routes both cut emissions by over 23 per cent, aided by transitions from E190s to A220-300s. In Brazil, Azul’s Belo Horizonte-Ilheus route dropped 27.1 per cent, with ATR turboprops replacing regional jets. These aren’t marginal gains; they show how quickly emissions can shift when operational changes meet scale.
Despite this, Indian carriers were largely absent from the top improvement charts. It’s a noticeable omission, one that raises questions about either a lack of qualifying routes under Cirium’s criteria or slower transitions in aircraft deployment strategies.
India: Visible in Rankings, Missing in Momentum
India’s presence in the emissions review feels paradoxical. On one hand, IndiGo and Air India Express rank among the world’s most efficient airlines. On the other, Indian carriers are almost invisible in the regional and inter-regional breakdowns, and entirely missing from route-level improvement rankings.
Why the discrepancy?
Part of it may be structural. India’s aviation market is still overwhelmingly domestic, with relatively short average sector lengths (IndiGo’s average: 1,036 km) and limited long-haul network exposure. The sector also faces delayed widebody modernisation, with Air India’s fleet average age still hovering above 11 years prior to recent orders.
There’s also a data challenge. Cirium’s criteria for inclusion, such as flying a route more than 300 times annually with verifiable emissions inputs, may not yet be fully met by Indian carriers on their inter-regional sectors. If that’s the case, it underscores the need not just for cleaner flying, but better visibility and reporting.
The lesson is two-fold: India is doing something right on short-haul efficiency, but the rest of its emissions narrative is yet to be written. As international operations expand and widebody renewals arrive, the next few years will determine whether Indian aviation leads or lags in the global sustainability story.

“Emissions performance looks different depending on where—and how—you fly. These regional breakdowns give a more nuanced view, helping users see patterns and benchmarks that might not be obvious from global averages alone.”
— Kevin O’Toole, Chief Strategy Officer, Cirium
EmeraldSky and the Metrics That Matter
At the core of Cirium’s review lies EmeraldSky, a real-time emission tracking platform built on operational flight data, not estimated fuel burn. It incorporates variables like taxi time, payload, air traffic delays, aircraft configuration, and engine type. Unlike other models, it doesn’t stop at theoretical distance, it processes actual gate-to-gate performance.
“EmeraldSky achieves an independently calculated unrivalled >99% accuracy on emissions for a specified set of mission, aircraft and payload inputs, providing the data integrity required for credible sustainability reporting.”
— Andrew Doyle, Senior Director, Market Development, Cirium
Backed by ISAE 3000 Reasonable Assurance from PwC and accredited under the Pegasus Guidelines by the Rocky Mountain Institute, EmeraldSky sets benchmarks. And in an industry increasingly shaped by ESG disclosures and Scope 3 accountability, that matters more than ever.
A Turning Point, If the Industry Chooses It
The Cirium Emissions Review doesn’t pretend to solve aviation’s carbon problem. But what it offers credibly, and with rigour, is a foundation of comparability. In a sector where ambition often exceeds transparency, it hands the industry a mirror.
The report reveals tangible progress, while also acknowledging that the sector’s total emissions continue to rise with demand growth. It exposes the limitations of current Sustainable Aviation Fuel (SAF) adoption, which accounts for only 0.53 per cent of global demand (IATA 2024), the reason why the report does not factor SAF into its analysis.
For India, that mirror reflects both pride and pressure. Efficient domestic carriers are already making their mark, but the absence of deeper engagement, visibility, and inter-regional performance signals the work still ahead.
As the skies get busier, the emissions narrative will only grow louder. What Cirium shows through numbers, not noise, is that change is not only possible. It’s measurable.
This article was co-authored by Vishal Duggal.
Read the complete report here: