


- India records 4.6 billion intercity trips annually, yet air carries only about 3–4% of domestic movement.
- Nearly 90% of travel occurs within 400 nautical miles, making short-haul connectivity central to aviation growth.
- Airport access time and network density—not fleet size alone—will determine how much of that mobility shifts to air.

India’s aviation debate often begins with fleet orders and metro capacity. But a closer look at how Indians actually move across the country tells a different story—one that begins not in the air, but on the ground.
At the 4th Airlines Economics Growth Frontiers conference, Jean-Pierre Clercin, Head APAC, ATR, presented a detailed analysis of India’s domestic mobility patterns, built not on airline booking data but on observed movement across the country. The findings offer a structural view of where aviation stands—and where it could go next.
India records roughly 4.5–4.6 billion intercity journeys each year. Of that, aviation accounts for about 150 million domestic passengers, placing air travel’s modal share at just 3–4%. In other words, more than 95% of domestic mobility still takes place by road or rail.
The contrast is stark. In China, air accounts for about 8% of domestic travel. In many mature markets, the share approaches 10%. India’s aviation sector, despite its growth headlines, still captures only a small fraction of total movement.
More revealing is the distance profile of these journeys. According to ATR’s mobility assessment, 90% of domestic trips occur within 400 nautical miles. In other words, most economic and social interaction in India takes place over relatively short sectors.
This is not simply a regionalisation narrative. It is a mobility pattern rooted in proximity—family, commerce, administration and industry concentrated within dense geographic clusters.
Measuring Movement, Not Just Tickets
To understand this pattern, ATR developed what it calls a “mobility monitor”. The study analysed 20 million GPS data points from devices across India to map actual displacement rather than relying solely on airport or booking statistics.
By defining catchment areas around airports and identifying origin-destination clusters—including regions without existing air service—the exercise aimed to answer a planning question: where is latent demand located, and how does access shape behaviour?
One of the strongest findings relates to airport proximity. When travel time to an airport increases from within 30 minutes to beyond 90 minutes, the likelihood of air travel drops by roughly a factor of three.
The implication is practical. Access time, not just geographic distance, determines mode selection. This has relevance not only for new airport planning but also for secondary airport development in large metros where surface travel times are already stretching beyond 90 minutes.

India currently has 121 airports with scheduled services. These serve catchment areas accounting for about 2.5 billion of the country’s annual trips—just over half of total domestic mobility. That leaves a substantial portion of mobility outside effective air access.
Government plans envision increasing operational airports to 200–230 within five to six years, with a longer-term ambition of 400 airports by 2047 . According to ATR’s modelling, expanding to around 200 airports would add approximately 1.25 billion trips into viable air catchment zones—a 50% increase in accessible demand .
Under that scenario, domestic passengers could rise from 150 million to roughly 240 million annually—an increase of about 90 million. Of those additional passengers, around 35 million would represent new regional flows rather than redistribution from trunk sectors.
Even then, aviation’s modal share would move only from about 3% to 3.7%—still modest in global comparison. For comparison, the United States records around 800 million domestic passengers annually, with a population roughly one-fifth of India’s. Tier-2 to Tier-3 connections are expected to drive a significant portion of this incremental demand, reinforcing the short-haul structure of India’s mobility profile.
Network Density Versus Distance
Beyond the numbers, the analysis turns to how networks actually function. Drawing on gravity models used in economics and migration studies, interaction between cities rises with economic mass and weakens with distance. Most activity concentrates at shorter ranges—mirroring the 400 nautical miles reality visible in India’s travel data. Put simply, the further apart two cities are, the weaker the natural flow between them.
In aviation, this translates into a structural distinction: long routes extend networks, but short routes compound them. Adding a spoke into a hub does not create a single market; it multiplies indirect city pairs. Connectivity expands non-linearly.
Operationally, short sectors allow higher daily aircraft cycles, greater frequency, and broader connection options. They also distribute capital risk. A disrupted long-haul sector absorbs far more aircraft time and exposure than a short sector operating multiple rotations per day.
This positions regional aviation not as a peripheral activity but as a system-builder. Trunk routes extend reach. Dense short-haul networks reinforce it.

This logic feeds directly into aircraft economics. On sectors averaging around 300 nautical miles, a regional jet carries a 41% cost disadvantage per seat compared to a turboprop. Fuel alone can be approximately $800 higher per flight on that stage length. The efficiency differential reflects propulsion optimisation: turboprops are structurally better suited to short-haul sectors.
The advantage is mechanical rather than theoretical: turboprops are optimised for short sectors and lower cruise altitudes, aligning more closely with how India’s domestic trips are distributed.
If 90% of domestic trips occur within 400 nautical miles, the aircraft choice becomes less about speed and more about cost per seat, frequency economics, and network layering.
Based on current mobility patterns and expansion to around 200 airports, ATR’s modelling indicates that roughly 3,300 aircraft would be required to serve the total projected demand. Within the regional segment alone, demand is estimated at approximately 600 aircraft—before accounting for fleet renewal and long-term GDP growth effects.
Operating Footprint in India

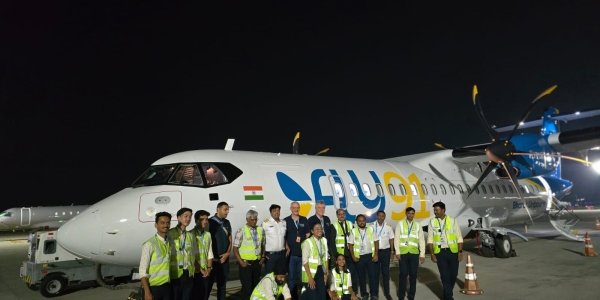
ATR has operated in India for 25 years, with 70 aircraft in service across three airlines. Operators include IndiGo, Alliance Air, and Fly91, supported by MRO and training infrastructure.
The company positions itself within the network-building segment rather than long-haul expansion, aligning aircraft economics with the country’s short-distance mobility structure.
Clercin put it simply: “Regional aviation fundamentally is about density.”
If India’s next aviation chapter is shaped by how efficiently it connects Tier-2 and Tier-3 markets into broader economic systems, the numbers suggest that regional capacity—and the infrastructure that supports it—will define the trajectory as much as headline fleet orders.
Also Read: Where Does the E175 Fit in India’s Narrowbody Market?